About the Project
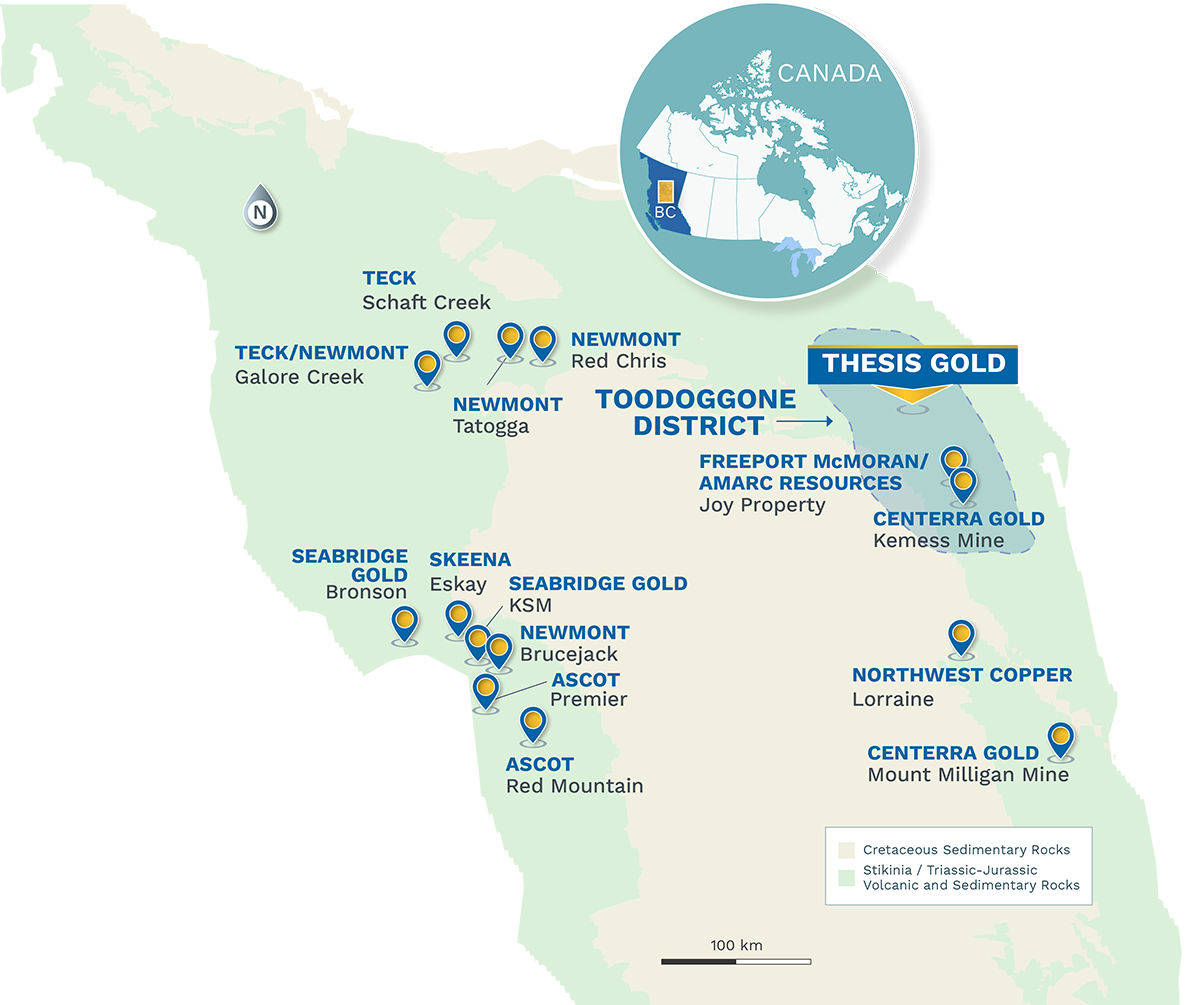
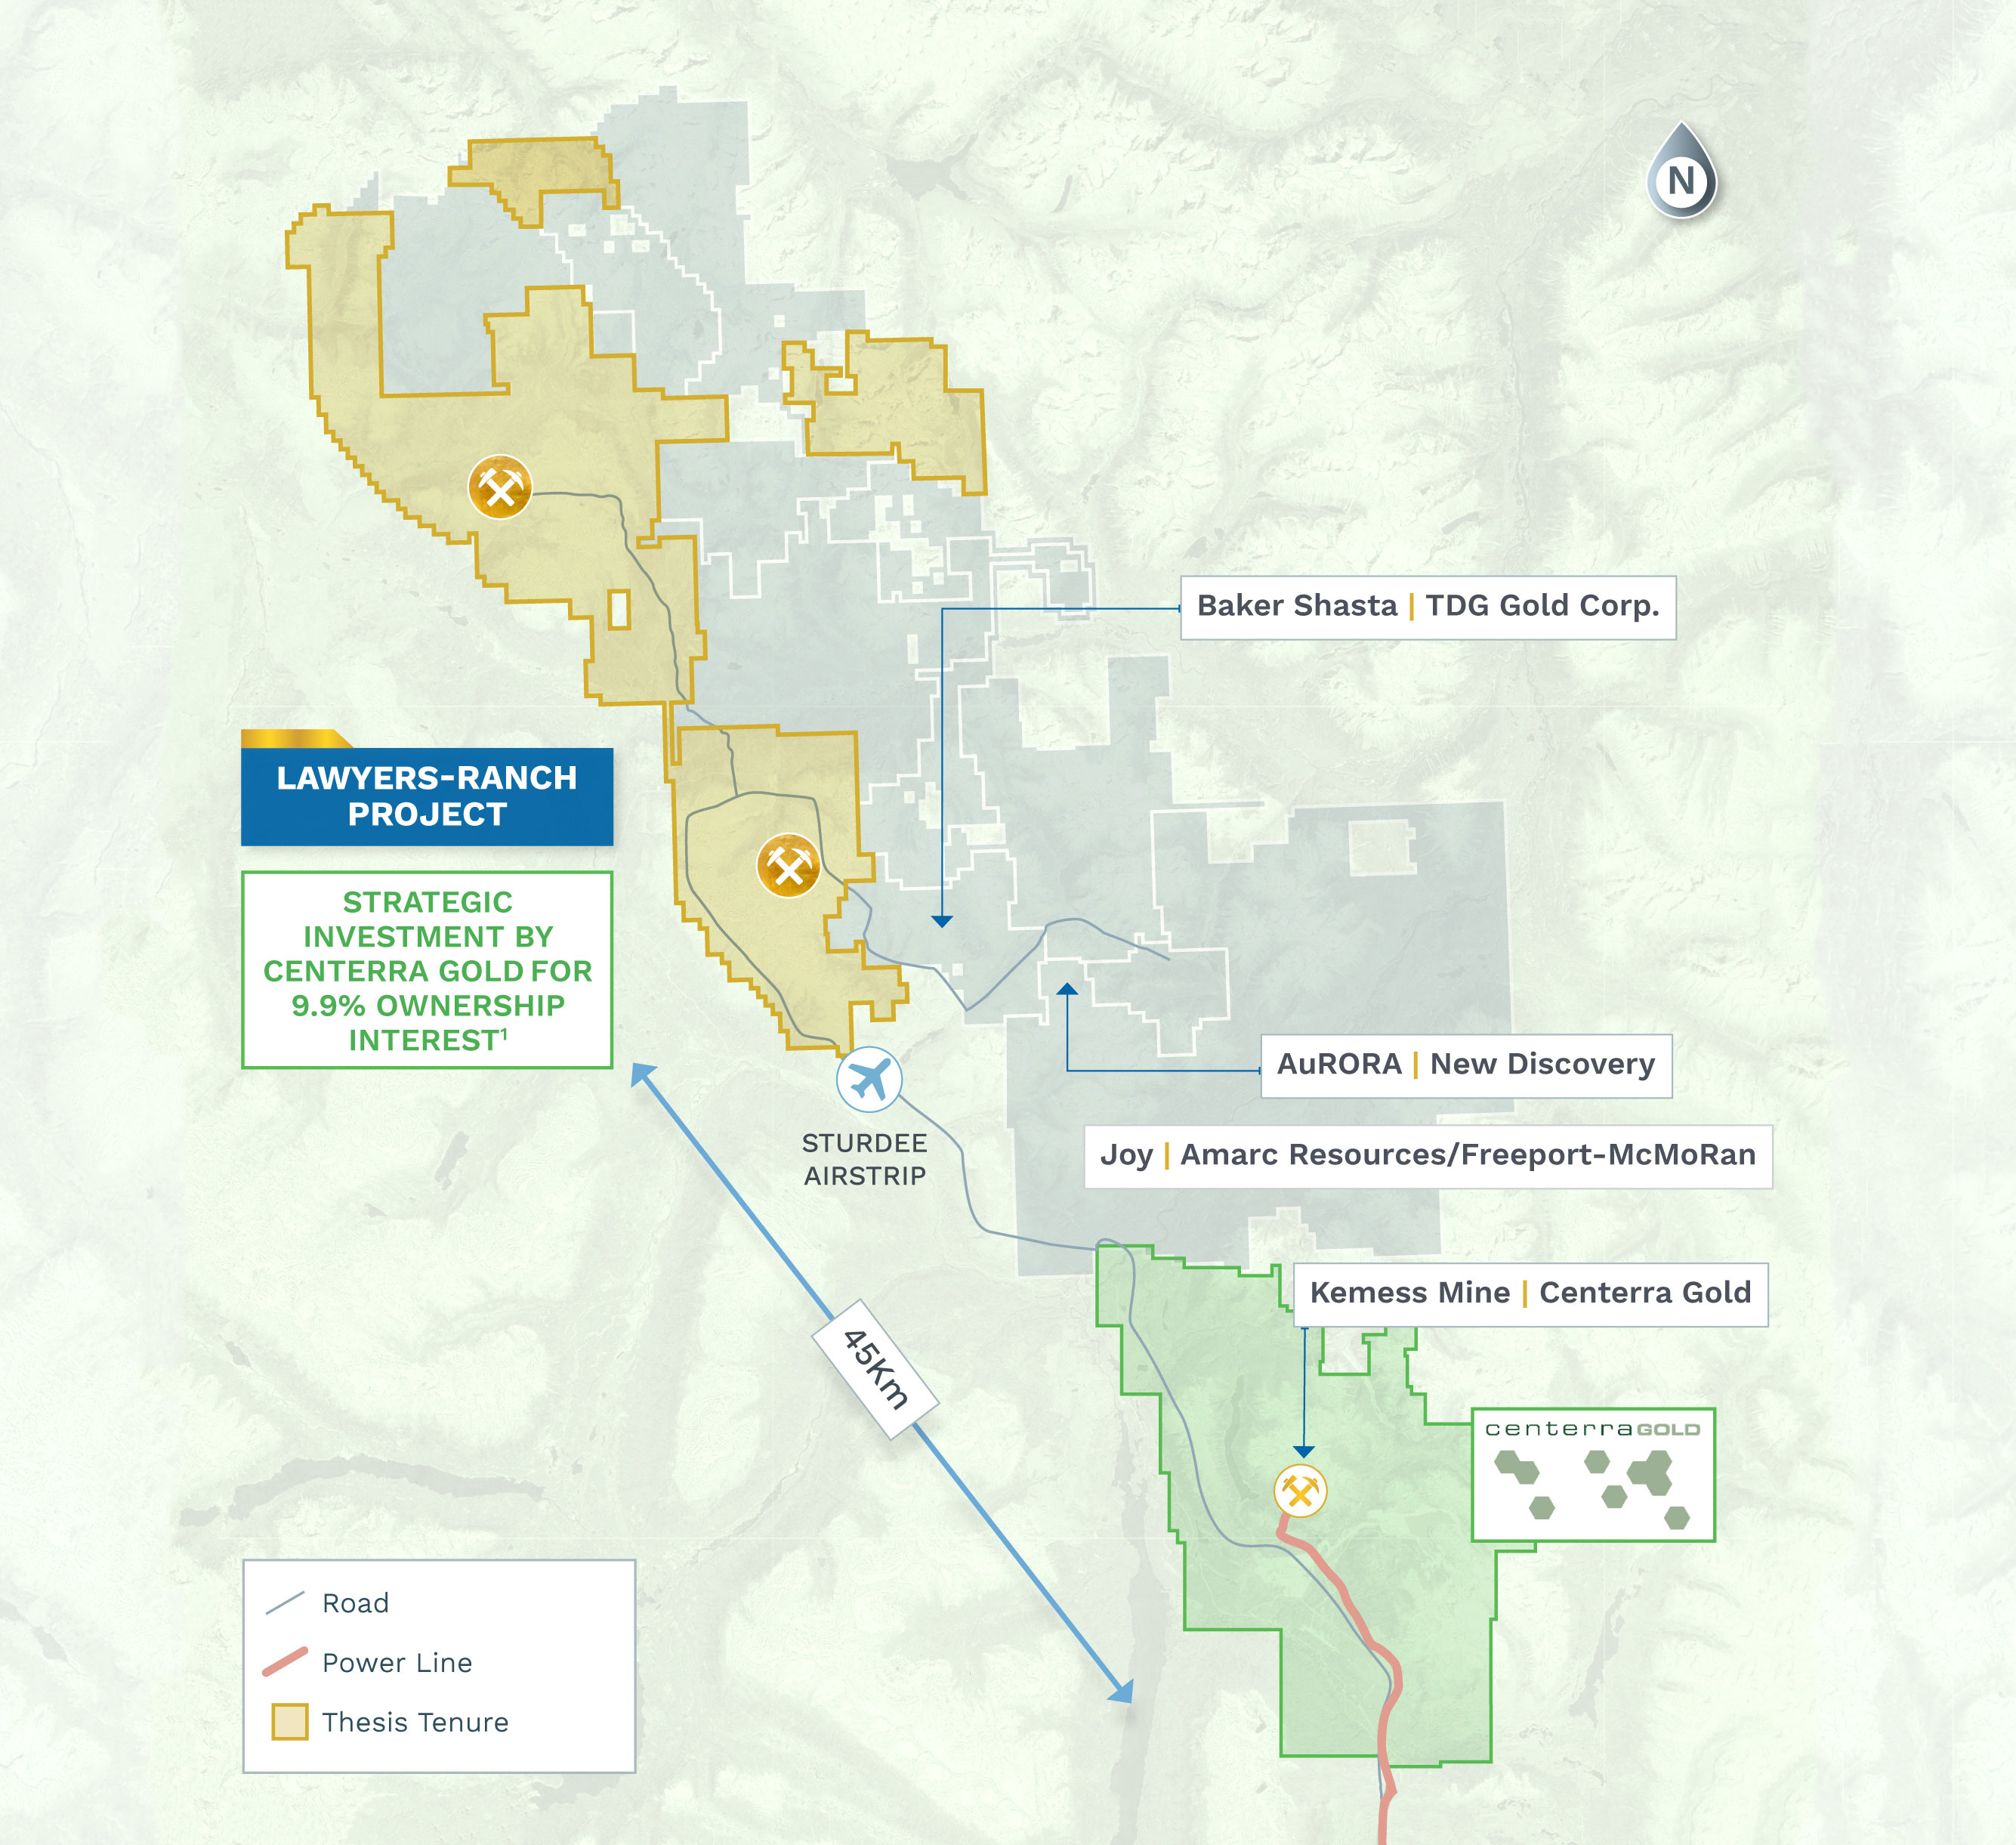
The Lawyers-Ranch Project is a premier precious metals gold/silver project in the Toodoggone Mining District of northern British Columbia. Thesis is actively advancing the project through permitting and development while continuing exploration across its 495 km2 district-scale land package.
Lawyers-Ranch contains 4.6 Moz of epithermal-style gold-equivalent ounces (4.6 Moz AuEq M&I at 1.21 g/t), inclusive of Proven and Probable Mineral Reserves of 3.2 Moz AuEq at 1.33 g/t, and 643 koz AuEq Inferred at 1.23 g/t) in addition to numerous undrilled epithermal targets and underlying porphyry potential.
2025 PFS Economic Highlights (at US$ 2,900/oz Au & US$ 35/oz Ag)
C$ 2371 M
After-Tax NPV5%
54.7% IRR
After-Tax
1.1 Year Payback
After-Tax
USD $1185/oz AuEq
AISC2
2025 PFS Operational Highlights
266 koz/year AuEq3
Annual production first 5 years
Ag is 23%
of LOM revenues2
4.6 Moz AuEq M&I
Mineral Resources (including Mineral Reserves) and 643 koz AuEq Inferred Mineral Resources1
15.2 year
Mine Life1
(1) Refer to the news release dated December 1, 2025 entitled “Thesis Gold Announces Positive Prefeasibility Study for Lawyers-Ranch Project: After-Tax NPV5% of $2.37 Billion and 54.7% IRR”
(2)AISC costs consist of mining costs, processing costs, mine-level G&A, offsite charges, royalties, sustaining capital, expansion capital, and closure costs. Economic assumptions used include US$2,900/oz Au, US$35/oz Ag, 0.73 US$:CAD$ FX, process recoveries of 93% for the Lawyers and Ranch Areas, 86% and 88% Ag for the Lawyers and Ranch Areas, respectively, and 85% Cu for Ranch Area, and processing and G&A costs of CAD$17/t and CAD$6/t, respectively. AuEq values are calculated using an Au-to-Ag ratio of 1:80. Cu is not included in the AuEq calculation.
(3) Gold equivalency ratios used: Au:Ag 1:80, and Au:Cu 1:7,315 on a ppm basis.
Project Highlights
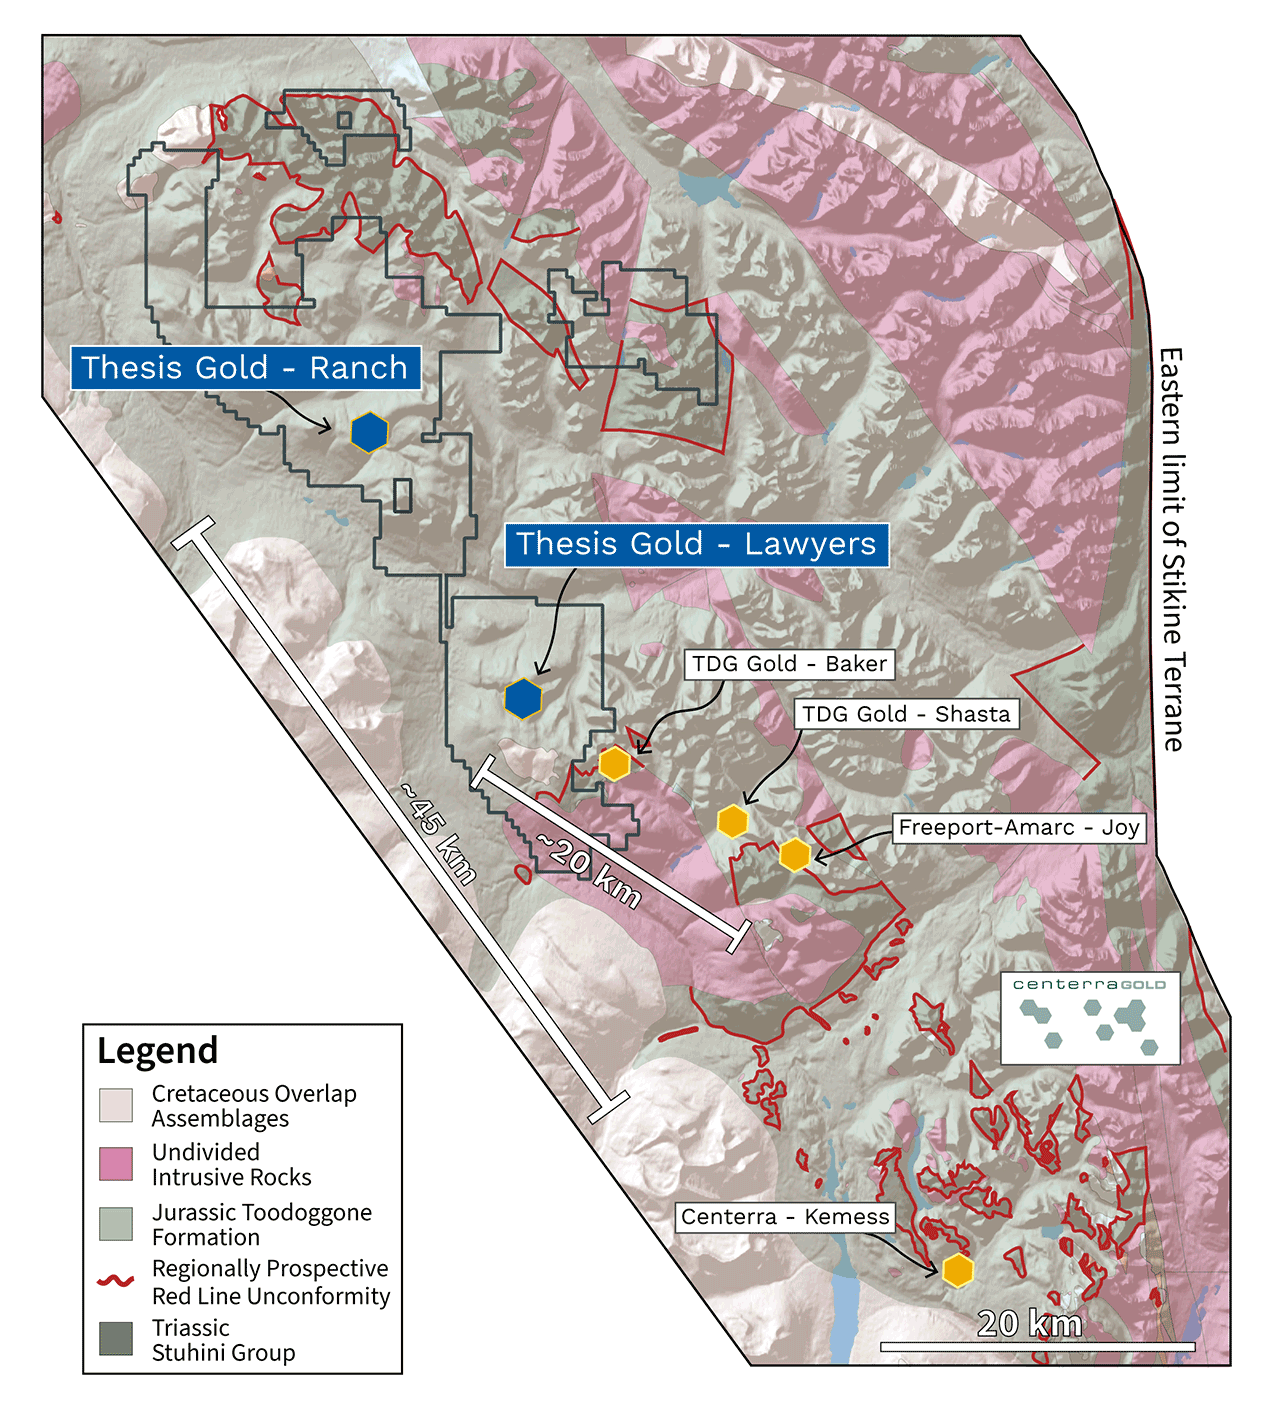
Excellent Infrastructure and Access – Year-round road accessible with a permitted airstrip and potential for a nearby power tie-in; Lawyers-Ranch is approximately 45 km from the Kemess Copper-Gold Mine
Significant Gold-Silver Reserves and Resources – Thesis has defined a total Mineral Reserve of 3.2 Moz AuEq (P&P) at 1.33 g/t AuEq, and a total Mineral Resource (including Mineral Reserves) of 4.5 Moz AuEq (M&I) at 1.21 g/t AuEq and 643 koz (Inf) at 1.23 AuEq
Silver production accounts for approximately 23% of project revenue Robust Pre-feasibility Study – The study outlines a high-margin, 15.2-year operation with strong projected economics leveraging existing infrastructure
District Scale Exploration Potential – numerous undrilled epithermal targets and underlying porphyry potential have been identified
Active Expansion and De-risking – Ongoing permitting, technical studies, exploration and expansion drilling, and field reconnaissance are unlocking new growth opportunities across the project
Project Timeline
-
2018
Acquired Lawyers Project and started modern exploration programs
-
2019
Started environmental, metallurgical and engineering studies at Lawyers Project
-
2020
Acquired Ranch Project and started modern exploration programs
-
2021
Established agreements and commitments with First Nations and started metallurgical studies at Ranch Project
-
2022
Published Mineral Resource Estimate and Preliminary Economic Assessment for Lawyers Project
-
2023
Started environmental studies at Ranch Project and consolidated Lawyers-Ranch Project in August.
-
2024
Published first global Mineral Resource Estimate and Preliminary Economic Assessment for Lawyers-Ranch Project, and started engineering studies and expansion of metallurgical studies at Ranch Project.
-
Q1 2025
Commenced Pre-feasibility Study for Lawyers-Ranch Project in January.
-
Q4 2025
Announced results of PFS. Commenced Environmental Assessment Process
-
Q1 2026
Commence Feasibility and Detailed Engineering Studies
-
2026
Expected Commencement of Feasibility Study/Detailed Engineering Studies
-
2027
Expected submission of Environmental Assessment Draft Application
-
Early 2029
Expected Environmental Assessment Decision
Pre-Feasibility Study
On December 1, 2025, Thesis Gold announced a Positive Prefeasibility Study (PFS) for the Lawyers-Ranch Project that significantly improved on a PEA released in 2024. The PFS was led by Ausenco Engineering Canada ULC and will be filed on SEDAR+ within 45 days of the announcement.
The PFS assumes:
A conventional truck and shovel open-pit mining (“OP”) operation with common equipment sizing feeding consisting of:
- A 13,700 tonnes per day industry standard processing plant with crushing, grinding, flotation, leaching and a Merrill Crowe recovery circuit to produce gold/silver doré bullion and concentrates on site
- Four pits at Lawyers site and 8 pits at Ranch site;
- A crossover to underground mining (“U/G”) from the Dukes Ridge, Cliff Creek, and Ranch Deposits from years 2 to 14 using longhole stoping and a small zone of drift-and-fill to feed up to 2,500 t/d.
- The 2025 PFS is based on a Mineral Resource Estimate which includes a maiden Mineral Reserve Estimate and was announced by the Company on December 1, 2025
The Company’s 2024 PEA was preliminary in nature. It included inferred Mineral Resources that are considered too speculative geologically to have the economic considerations applied to them that would enable them to be categorized as Mineral Reserves, and there was no certainty that the 2024 PEA would be realized. The Company’s 2025 PFS is the Company’s current technical report, and it entirely replaces the results of the 2024 PEA, which is no longer current and should no longer be relied upon. A copy of the Company’s 2024 PEA was filed on the Company’s SEDAR+ profile at www.sedarpus.ca on October 16, 2024.
| Assumptions | 2025 PFS* | 2024 PEA** | |
|---|---|---|---|
| Gold | USD/oz | 2,900 | 5,000 |
| Silver | USD/oz | 35 | 90 |
| F/X Rate | USD:C$ | 0.73 | 0.73 |
| Pre-Tax NPV (5%) | C$M | 3,730 | 10,483 |
| Pre-Tax IRR | % | 73.5 | 160.1 |
| After-Tax NPV (5%) | C$M | 2,370 | 6,655 |
| After-Tax IRR | % | 54.4 | 118.1 |
| After-tax Undiscounted Cash Flow | C$M | 3,802 | 10,200 |
| After-Tax Payback Period | Years | 1.1 | 0.5 |
| AISC1 | US$/AuEq1 oz | 1,185 | |
| Initial Capital | C$M | 736.2 | |
| Sustaining Capital | C$M | 789.4 | |
| LOM Avg. Head Grade | AuEq1 g/t | 1.31 | |
| Avg. AuEq2 Annual Production Yrs. 1-3 | oz per year | 266,000 | |
| LOM Avg. AuEq2 Annual Production | oz per year | 187,000 | |
| Mill Throughput | Tonnes per day | 13,700 | |
| Mine Life | Years | 15 | |
| Total Mine Production - Payable AuEq1 | koz | 2,837 | |
* Refer to the news release dated December 1, 2025, entitled “Thesis Gold Announces Positive Prefeasibility Study for Lawyers-Ranch Project: After-Tax NPV5% of $2.37 Billion and 54.4% IRR”.
**The Company’s 2024 PEA was preliminary in nature.It included inferred Mineral Resources that are considered too speculative geologically to have the economic considerations applied to them that would enable them to be categorized as Mineral Reserves, and there was no certainty that the 2024 PEA would be realized. The Company’s 2025 PFS is the Company’s current technical report, and it entirely replaces the results of the 2024 PEA, which is no longer current and should no longer be relied upon. A copy of the Company’s 2024 PEA was filed on the Company’s SEDAR+ profile at www.sedarpus.ca on October 16, 2024.
- AuEq reported for the mined materials/mill feed in mineral resource estimate and mineral reserve estimates assumes a conversion of 80:1 for Ag to AuEq based on expected average expected recoveries of 93% Au and 86.1% Ag at US$2,000/oz Au and $24.50/oz Ag. AuEq production values are based on payable ounces as calculated by the financial model and have varying gold and silver recoveries by deposit at a US$2,900/oz Au and US$35/oz Ag.
- AISC† costs consist of mining costs, processing costs, mine-level G&A, offsite charges, royalties, sustaining capital, expansion capital, and closure costs.
| Production | Unit | First 5-year Avg | LOM Total / Avg. |
| Mine Life | yrs | n/a | 15 |
| Total Processed Feed Tonnes | kt | 25,168 | 76,156 |
| Waste Mined | kt | 119,746 | 341,960 |
| OP Stripping Ratio | W:O | 6.5 | 4.6 |
| Head Grade - Au | g/t | 1.25 | 0.97 |
| Head Grade - Ag | g/t | 35.76 | 28.1 |
| Head Grade - AuEq* | g/t | 1.68 | 1.31 |
| Recovery Rate - Au | % | 92.9 | 92.8 |
| Recovery Rate - Ag | % | 79.4 | 81.6 |
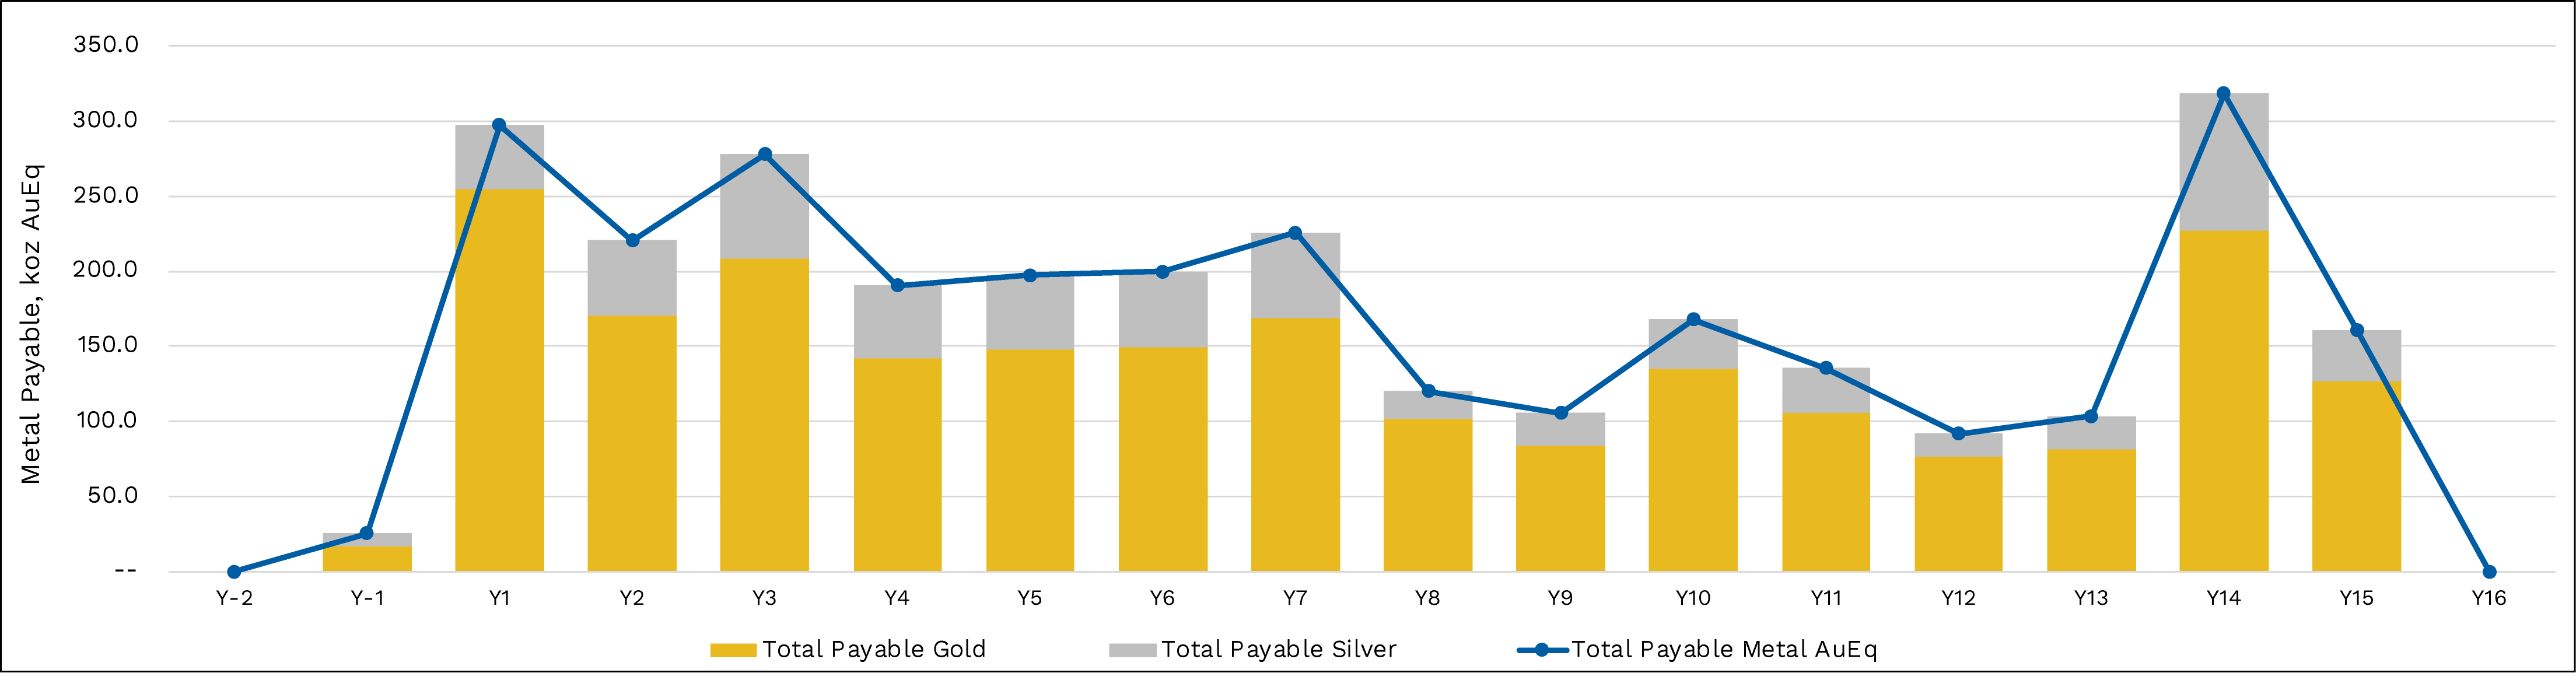
| Total Payable Au | koz | 924 | 2,198 |
| Total Payable Ag | koz | 21,460 | 52,940 |
| Total Payable AuEq** | koz | 1,183 | 2,837 |
| Average Annual Production - Au | koz/yr | 185 | 145 |
| Average Annual Production - Ag | koz/yr | 4,292 | 3,482 |
| Average Annual Production - AuEq** | koz/yr | 237 | 187 |
*AuEq reported for the mined materials/mill feed in mineral resource estimate and mineral reserve estimates assumes a conversion of 80:1 for Ag to AuEq based on expected average expected recoveries of 93% Au and 86.1% Ag at US$2,000/oz Au and $24.50/oz Ag.
**AuEq production values are based on payable ounces as calculated by the financial model and have varying gold and silver recoveries by deposit at a US$2,900/oz Au and US$35/oz Ag.
| Operating/Capital Costs | Pre-Production ($M) |
Sustaining/Closure ($M) |
Total (C$M) |
| Open Pit Mining | 79.1 | 181.0 | 260.1 |
| Underground Mining | 0.7 | 227.3 | 228.0 |
| Mineral Processing | 246.1 | 0.0 | 246.1 |
| Tailings and Waste Management | 70.7 | 293.1 | 363.8 |
| On-site Infrastructure | 103.1 | 0.0 | 103.1 |
| Off-site Infrastructure | 1.9 | 45.1 | 47.0 |
| Project Indirect Costs | 56.0 | 0.8 | 56.8 |
| Engineering, Procurement & Construction Management |
53.6 | 0.0 | 53.6 |
| Owner’s Costs | 20.1 | 0.0 | 20.1 |
| Closure | 0.0 | 71.8 | 71.8 |
| Subtotal 1 | 631.2 | 819.2 | 1,450.3 |
| Contingency | 98.7 | 42.0 | 140.7 |
| Subtotal 2 | 729.8 | 861.2 | 1,591.0 |
| Capitalized Process OPEX | 6.4 | 0.0 | 6.4 |
| Salvage Credit | 0.00 | (56.3) | (56.3) |
| Total Capital Costs | 736.2 | 804.9 | 1,541.1 |
- Total Capital Costs not considering potential pre-production revenue of $91.1 M from processing stockpiles as part of commissioning and ramp-up plan.
- LOM Operating Costs: $46.53/tonne
| Capital Costs | Initial Capital | Sustaining / Closure | Total | |
|---|---|---|---|---|
| Open Pit Mining | C$M | 62 | 113 | 175 |
| UG Mining | C$M | 0 | 251 | 251 |
| On-Site Development | C$M | 19 | 10 | 29 |
| Mineral Processing | C$M | 205 | 0 | 205 |
| Tailings & Waste Management | C$M | 54 | 56 | 109 |
| On-Site Infrastructure | C$M | 46 | 22 | 68 |
| Off-Site Infrastructure | C$M | 0.3 | 62 | 63 |
| Project Indirects | C$M | 67 | 5 | 72 |
| Engineering & Project Management | C$M | 42 | 6 | 48 |
| Owners Costs | C$M | 17 | 0 | 17 |
| Closure | C$M | 0 | 48 | 48 |
| Subtotal | C$M | 511 | 573 | 1084 |
| Contingency & Escalation | C$M | 88 | 22 | 109 |
| Total | C$M | 598 | 595 | 1193 |

Mineral Resource Estimate
The PFS is based on the Mineral Resource Estimate that includes the project’s maiden Mineral Reserve Estimate and was prepared by P&E Mining Consultants Inc., and APEX Geoscience Ltd., with an effective date of October 16, 2025. It is summarized below. Mineral Resources that are not Mineral Reserves do not have demonstrated economic viability.
Significant Mineral Resource growth potential remains across both Lawyers and Ranch projects:
- The underground Mineral Resource at Lawyers is open for expansion at depth
- Ranch Mineral Resource zones also remain open
- Over 20 undrilled targets hold potential for further discoveries.
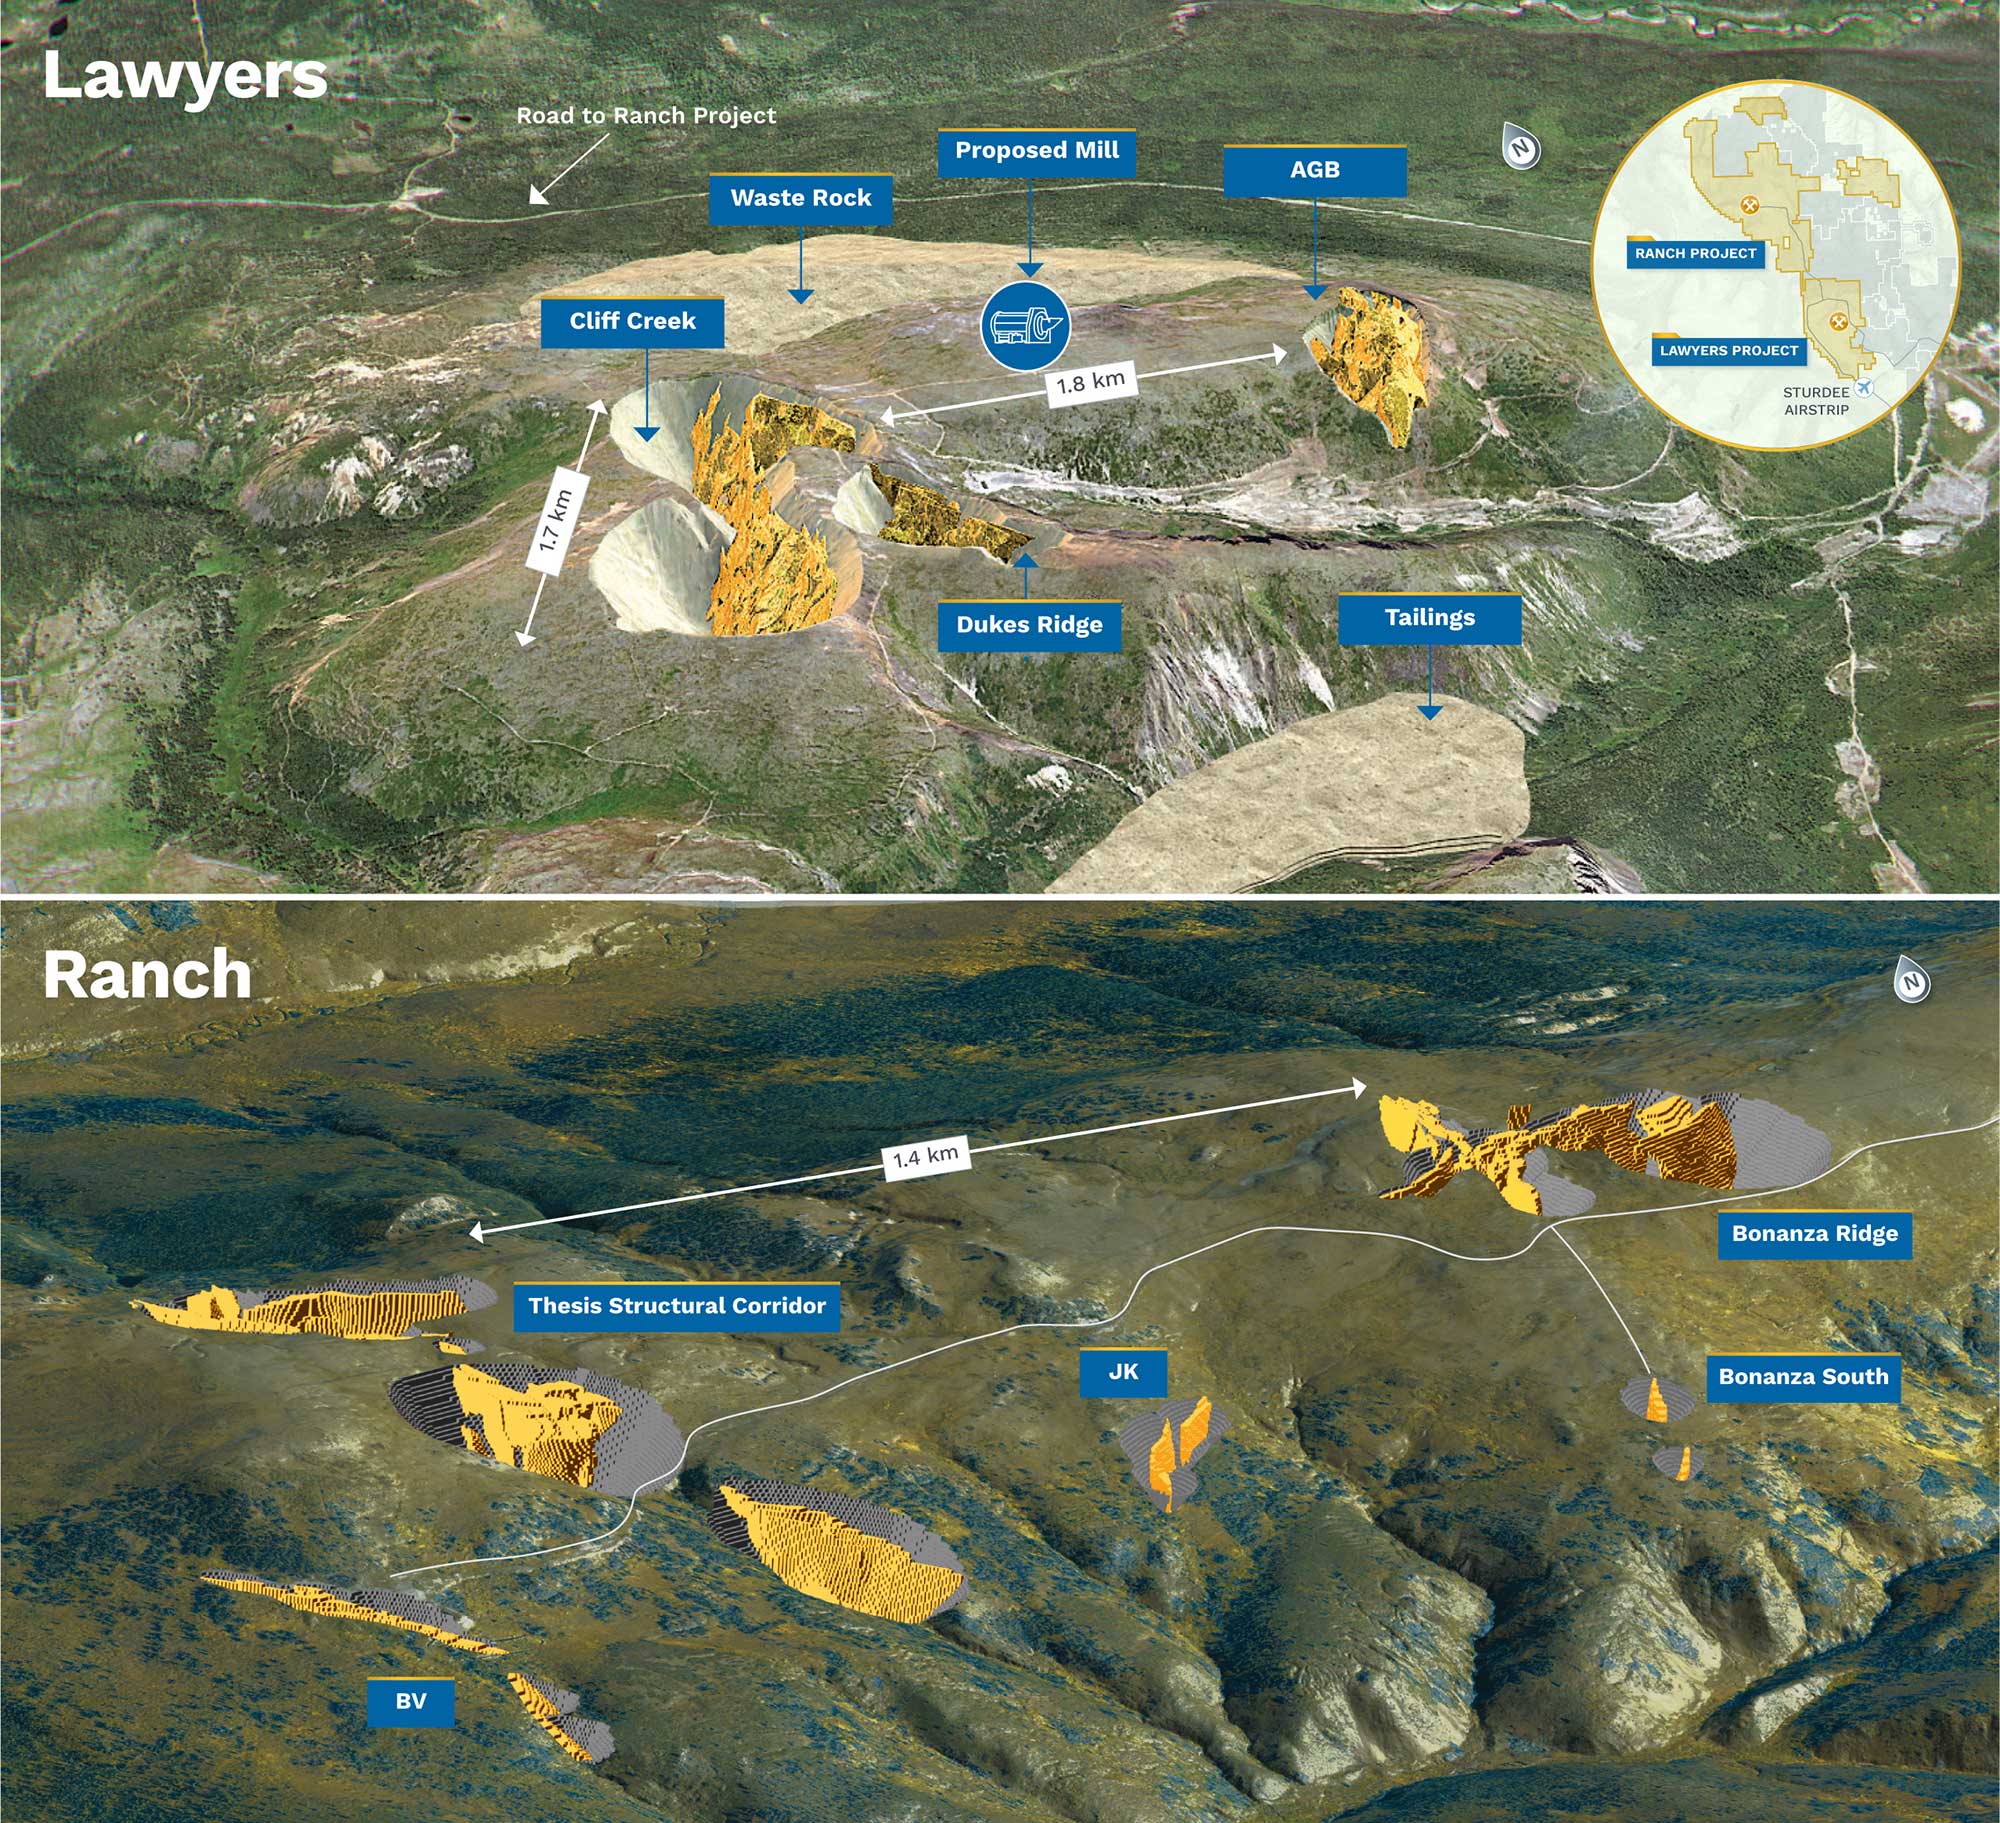
The Lawyers area contains the majority of the Mineral Resource hosted in low sulfidation style epithermal deposits, while the Ranch area, which makes up the remaining portion of the Mineral Resource, is a characteristic lithocap environment hosting high sulfidation deposits.
Mineral Resource Table
The PFS is based on the Mineral Reserve Estimate prepared by Mining Plus and reported by Thesis Gold with an effective date of October 27, 2025. The Mineral Reserve Estimate is summarized in Table below:
Summary of October 27, 2025, Mineral Reserve Estimate
| Category | Tonnes (kt) | Au (g/t) |
Ag (g/t) |
AuEq (g/t)7 |
Au (koz) | Ag (koz) | AuEq (koz) |
|---|---|---|---|---|---|---|---|
| Open Pit | |||||||
| Proven | |||||||
| Lawyers Area | 31,582 | 0.97 | 33.45 | 1.39 | 990 | 33,965 | 1,414 |
| Ranch Area | 365 | 3.66 | 1.11 | 3.67 | 43 | 13 | 43 |
| Open Pit Subtotal: Proven | 31,948 | 1.01 | 33.08 | 1.42 | 1,033 | 33,978 | 1,457 |
| Probable | |||||||
| Lawyers Area | 39,661 | 0.79 | 20.16 | 1.04 | 1,007 | 25,709 | 1,329 |
| Ranch Area | 2,134 | 1.65 | 11.69 | 1.80 | 113 | 802 | 123 |
| Open Pit Subtotal: Probable | 41,795 | 0.83 | 19.73 | 1.08 | 1,120 | 26,511 | 1,452 |
| Underground | |||||||
| Proven | |||||||
| Lawyers Area | 1,301 | 2.96 | 115.68 | 4.41 | 124 | 4,839 | 184 |
| Underground Subtotal: Proven | 1,301 | 2.96 | 115.68 | 4.41 | 124 | 4,839 | 184 |
| Probable | |||||||
| Lawyers Area | 1,112 | 3.08 | 95.55 | 4.28 | 110 | 3,416 | 153 |
| Underground Subtotal: Probable | 1,112 | 3.08 | 95.55 | 4.28 | 110 | 3,416 | 153 |
| Total | |||||||
| Proven | 33,249 | 1.08 | 36.31 | 1.54 | 1,156 | 38,817 | 1,642 |
| Probable | 42,907 | 0.89 | 21.69 | 1.16 | 1,231 | 29,927 | 1,605 |
| Proven + Probable | 76,156 | 0.97 | 28.08 | 1.33 | 2,387 | 68,743 | 3,246 |
Source: Mining Plus (2025)
Notes:
1. Classification of Mineral Reserves is in accordance with the CIM Definition Standards for Mineral Resources and Mineral Reserves (May 2014) of NI 43-101.
2. The independent and qualified person for the Mineral Reserve, as defined by NI 43-101, is Peter Lock, FAusIMM.
3. The effective date is October 27, 2025.
4. Open Pit Mineral Reserves are reported using an AuEq cut-off grade of 0.29 g/t AuEq for the Lawyers Area pits and a 0.37 g/t for the Ranch Area.
5. Underground Mineral Reserves are reported using a cut-off grade of 2.20 g/t diluted AuEq to determine the mining extents. Lower grade gaps within the extents were infilled using stopes that met the incremental cut-off grade of 1.7 g/t diluted AuEq. A lower mill feed cut-off grade of 1.5 g/t diluted AuEq was applied to mineralized development.
6. Processing costs used in the cut-off grade calculation were $C 15.77/t milled for Lawyers Area feed and $15.91/t milled for Ranch Area feed; the costs used for sustaining capital, G&A, and Ranch Area ore haul were $C 2.49/t milled, $C 5.23/t milled, and $C 5.80/t milled, respectively.
7. AuEq =Au + Ag/80, where Au is the gold grade in g/t and Ag is the silver grade in g/t.
8. Mineral Reserves are reported using long-term gold and silver prices of $US 2,000/oz and $US 24.50/oz, respectively, and a foreign exchange rate of 1CAD = 0.73USD.
9. The gold processing recovery assumptions used were 92.9% for the Lawyers Area mill feed and 93.2% for the Ranch Area feed. The silver processing recovery assumptions used were 86.1% for Lawyers Area mill feed and 88.4% for Ranch Area mill feed.
10. A minimum mining width of 2.5 m was used for all underground assets.
11.Rounding as required by reporting guidelines may result in apparent summation differences between tonnes, grade and contained metal content.
Summary of October 16, 2025 Mineral Resource Estimate
| Mineral Resource Area |
Cut-off AuEq (g/t) |
Classification | Tonnes (k) |
Au (g/t) |
Ag (g/t) |
Cu (%) |
AuEq (g/t) |
Au (koz) |
Ag (koz) |
Cu (kt) |
AuEq (koz) |
|---|---|---|---|---|---|---|---|---|---|---|---|
| Pit-Constrained Mineral Resource Estimate | |||||||||||
| Lawyers Area | 0.25 | Measured | 50,674 | 0.91 | 31.9 | 0.00 | 1.31 | 1,482 | 51,920 | 0 | 2,131 |
| Indicated | 61,778 | 0.77 | 21.0 | 0.00 | 1.03 | 1,527 | 41,737 | 0 | 2,049 | ||
| M&I | 112,452 | 0.83 | 25.9 | 0.00 | 1.16 | 3,009 | 93,657 | 0 | 4,179 | ||
| Inferred | 8,583 | 0.59 | 16.3 | 0.00 | 0.80 | 164 | 4,509 | 0 | 220 | ||
| Ranch Area | 0.25 | Measured | 376 | 3.91 | 1.3 | 0.02 | 3.93 | 47 | 16 | 0 | 47 |
| Indicated | 3,502 | 1.77 | 10.1 | 0.06 | 1.90 | 200 | 1,137 | 2 | 214 | ||
| M&I | 3,878 | 1.98 | 9.3 | 0.06 | 2.10 | 247 | 1,153 | 2 | 261 | ||
| Inferred | 5,785 | 1.50 | 4.7 | 0.10 | 1.56 | 279 | 876 | 6 | 290 | ||
| Total | 0.25 | Measured | 51,049 | 0.93 | 31.6 | 0.00 | 1.33 | 1,529 | 51,936 | 0 | 2,178 |
| Indicated | 65,281 | 0.82 | 20.4 | 0.00 | 1.08 | 1,727 | 42,874 | 2 | 2,263 | ||
| M&I | 116,330 | 0.87 | 25.3 | 0.00 | 1.19 | 3,256 | 94,810 | 2 | 4,441 | ||
| Inferred | 14,369 | 0.96 | 11.7 | 0.04 | 1.10 | 443 | 5,385 | 6 | 510 | ||
| Out-of-Pit Mineral Resource Estimate | |||||||||||
| Lawyers Area | 1.20 | Indicated | 1,173 | 2.20 | 81.5 | 0.00 | 3.21 | 83 | 3,073 | 0 | 121 |
| Inferred | 1,334 | 1.72 | 51.7 | 0.00 | 2.36 | 74 | 2,216 | 0 | 101 | ||
| Ranch Area | 1.20 | Indicated | 26 | 1.89 | 6.6 | 0.09 | 1.98 | 2 | 5 | 0 | 2 |
| Inferred | 530 | 1.80 | 4.2 | 0.16 | 1.85 | 31 | 71 | 1 | 32 | ||
| Total | 1.20 | Indicated | 1,199 | 2.19 | 79.8 | 0.00 | 3.19 | 84 | 3,078 | 0 | 123 |
| Inferred | 1,863 | 1.74 | 38.2 | 0.05 | 2.22 | 104 | 2,286 | 1 | 133 | ||
| Total Mineral Resource Estimate | |||||||||||
| All | Combined | Measured | 51,049 | 0.93 | 31.6 | 0.00 | 1.33 | 1,529 | 51,936 | 0 | 2,178 |
| Indicated | 66,480 | 0.85 | 21.5 | 0.00 | 1.12 | 1,811 | 45,952 | 2 | 2,386 | ||
| M&I | 117,529 | 0.88 | 25.9 | 0.00 | 1.21 | 3,340 | 97,888 | 2 | 4,564 | ||
| Inferred | 16,232 | 1.05 | 14.7 | 0.04 | 1.23 | 547 | 7,671 | 7 | 643 | ||
Source: APEX (2025)
Notes:
1. Mr. Eugene Puritch, P.Eng., FEC, CET, and Mr. Yungang Wu, M.Sc., P.Geo., of P&E Mining Consultants Inc., are independent Qualified Persons as defined by NI 43-101 and are responsible for the Mineral Resource Estimate, with an effective date of October 16, 2025.
2. Mineral Resources include Mineral Reserves. Mineral Resources that are not Mineral Reserves do not have demonstrated economic viability.
3. The estimate of Mineral Resources may be materially affected by environmental, permitting, legal, title, taxation, socio-political, marketing, or other relevant issues.
4. The Inferred Mineral Resource in this estimate has a lower level of confidence than that applied to an Indicated Mineral Resource and must not be converted to a Mineral Reserve. It is reasonably expected that the majority of the Inferred Mineral Resource could potentially be upgraded to an Indicated Mineral Resource with continued exploration.
5. The Mineral Resources were estimated in accordance with the Canadian Institute of Mining, Metallurgy and Petroleum (CIM), CIM Standards on Mineral Resources and Reserves, Definitions (2014) and Best Practices Guidelines (2019) prepared by the CIM Standing Committee on Reserve Definitions and adopted by the CIM Council.
6. Historical mined areas were removed from the block-modelled Mineral Resources.
7. The Lawyers Area includes the Cliff Creek (CC), Dukes Ridge (DR), Phoenix (PX), and Amethyst Gold Breccia (AGB) zones. The 2025 MRE includes updates to the CC, DR, and PX zones since the 2024 MRE. The AGB block model remains unchanged from the 2022 MRE but is restated with updated RPEEE constraints.
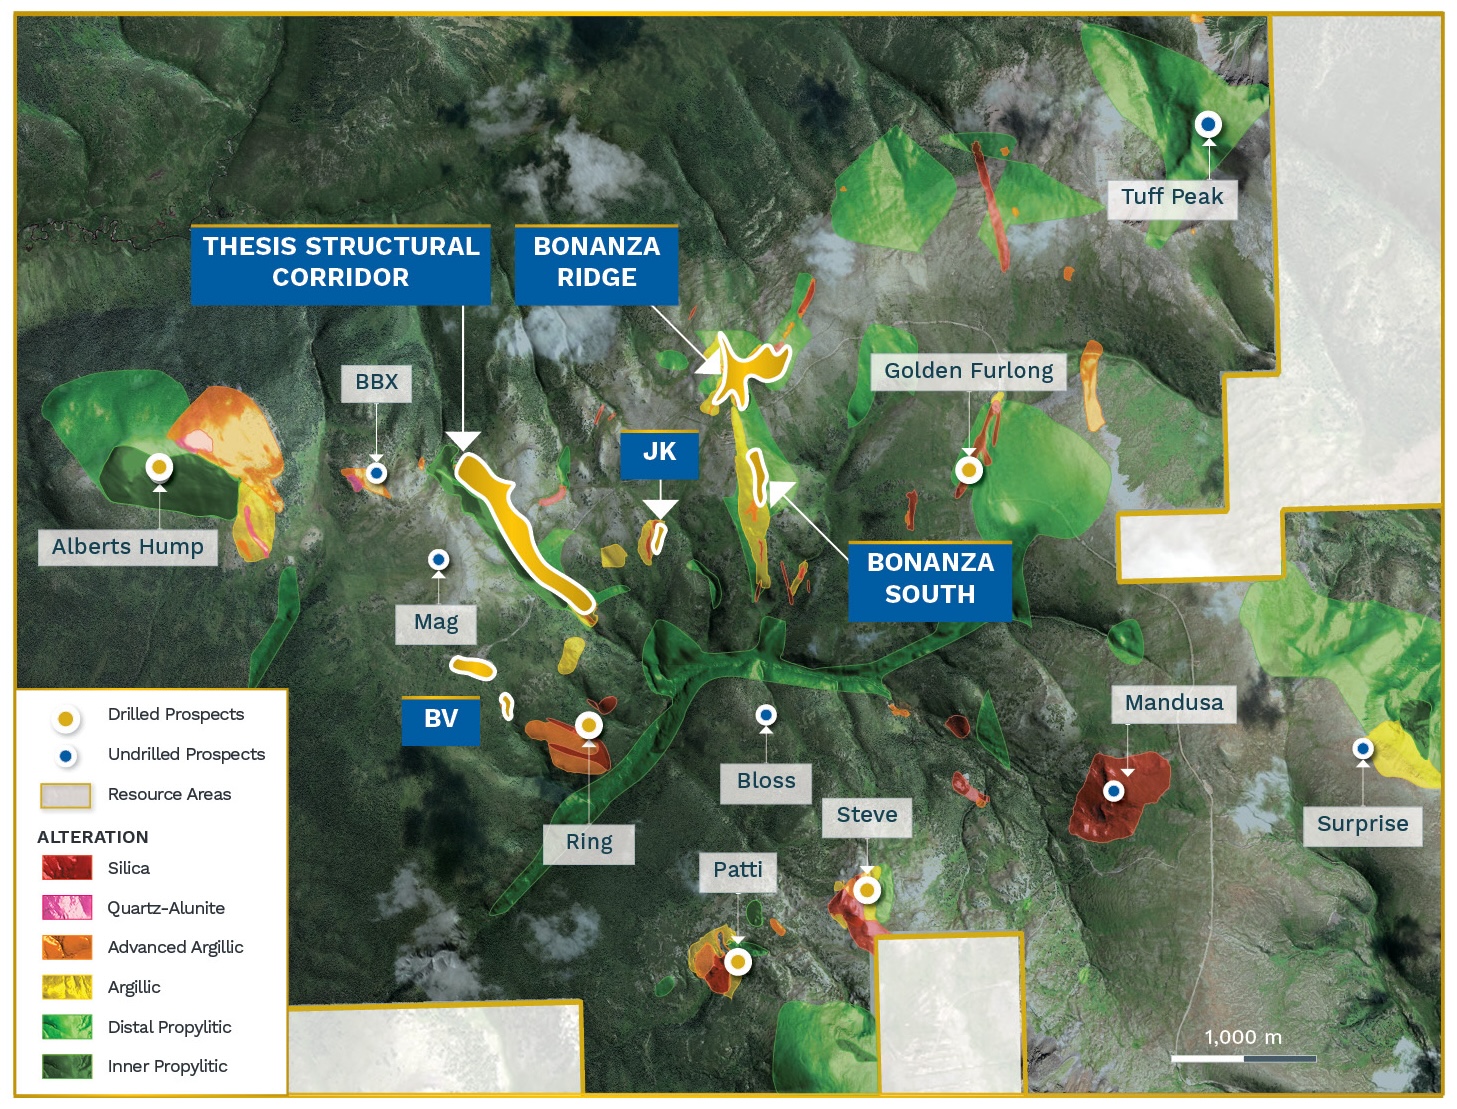
8. The Ranch Area includes the Thesis II, Thesis III, Bingo, Barite Vein (BV), Bonanza-South, JK, Bonanza, and Ridge zones. The 2025 MRE updates all Ranch Area zones from the 2024 MRE.
9. Economic assumptions include metal prices of US$2,500/oz Au, US$30/oz Ag, and US$8,800/tonne Cu; an exchange rate of 0.73 US$:CAD$; process recoveries of 93% Au for both Areas, 86% and 88% Ag for the Lawyers and Ranch areas, respectively, and 85% Cu for the Ranch Area; and processing and G&A costs of CAD$17/t and CAD$6/t, respectively. AuEq values are calculated using an Au-to-Ag ratio of 1:80. Cu is not included in the AuEq calculation.
10. Pit-constrained Mineral Resources include blocks within an optimized pit shell derived using the economic assumptions described above, together with a mining cost of CAD$4.0/t for mineralized and waste material, and pit slopes of 52° and 48° for the Lawyers and the Ranch Areas, respectively.
11. Out-of-pit Mineral Resource Estimates include blocks below the constraining pit shell that form continuous and potentially mineable shapes, derived using the economic assumptions described above together with a mining cost of CAD$90/t. These parameters result in an out-of-pit cut-off grade of 1.20 g/t AuEq. Mining shapes encapsulate material within domains with a minimum horizontal width of 2.0 m (perpendicular to strike) and target vertical and horizontal dimensions of approximately 10 m (H) by 20 m (L).
EXPLORATION OPPORTUNITIES
A geological framework consistent with major deposits across northern British Columbia
The Toodoggone Mining District and the Golden Triangle share many geological similarities including their tectonic setting and magmatic-volcanic history.
The “red line” unconformity, first recognized in the Golden Triangle, is a boundary between Triassic and Jurassic rocks widely accepted as a prospectivity marker for porphyry and epithermal mineralization in the Golden Triangle. This stratigraphic boundary is also present in the Toodoggone District, where a similar spatial link exists with known deposits.
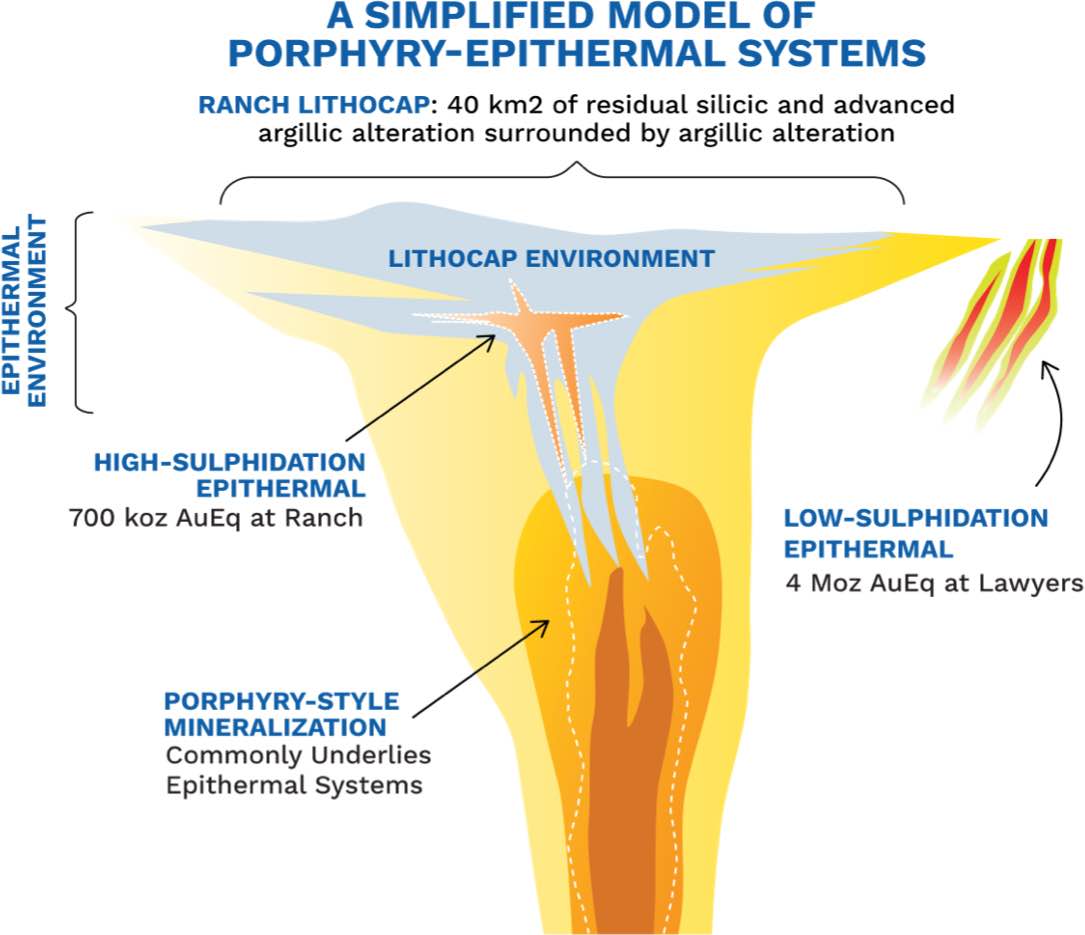
A 40 Square-Kilometer Lithocap Footprint
Silica and clay alteration at Ranch are characteristic of the minerals and textures that form in the lithocap environment of a magmatic-hydrothermal system. The Ranch Lithocap is a 40 km2 alteration footprint that contains numerous undrilled epithermal targets.
These targets present significant discovery potential to build on the ~700 koz AuEq currently defined at Ranch.
District-scale land package with system-scale potential
Approximately 82% of the resource is hosted in low sulfidation style epithermal mineralization at Lawyers. The remaining resource is hosted in localized deposits within the larger Ranch lithocap footprint, a characteristic high sulfidation environment.
There is a well-established link between epithermal and porphyry deposits formed in magmatic-hydrothermal systems. The epithermal style gold-silver mineralization at Ranch and Lawyers represent the hydrothermal part of the system, and may be linked to an underlying porphyry at depth.